


On Wednesday, July 31st, 2019 the Federal Reserve decided to cut interest rates for the first time s...
Financial Wellness Center

Mar 12, 2025
Written By: Nate Garrison, CIO, World Investment Advisors
What is causing the recent market volatility and downturn?
Rising concerns, initially over inflation and now over economic growth, have been contributing to recent volatility in equity markets.
The Trump administration’s almost daily announcements about new and evolving US economic and foreign policies are increasing uncertainty among market participants about the prospects of rising inflation and weaker economic growth in the United States.
When uncertainty rises, “risk assets” are often reduced in portfolios. We have seen a rotation out of the most successful assets of the past few years, particularly large-cap growth stocks. This asset class has some of the richest (and riskiest) valuations. Investors have turned to international equities where there currently is less perceived policy uncertainty and an improving economic outlook.
How does this drawdown compare to history?
A key point to consider: All Time Highs (ATH) are relatively rare, and drawdowns are frequent!
The S&P 500 Index recently closed at an ATH of 6144.15 on 2/19/25 before coming down to 5,572.07 on 3/11/25. This represents a drawdown of -9.31% off its most recent peak.
- This is slightly worse than the most recent drawdown in the past year, which bottomed out on 8/5/24 with a decline of -8.45%.
The worst drawdowns in recent years post-Financial Crisis were:
- During the COVID pandemic (bottomed out on 3/23/20 at a -33.79% decline)
- The Bear Market of 2022 (bottomed out on 10/12/22 at -24.29%)
- The Christmas Crash of December 2018 (bottomed out on 12/24/18 at -19.36%)
- This drawdown pales in comparison to those drawdowns!
Over the past 20 years since 3/10/2005, the S&P 500 Index has set 931 new ATHs. During the other 6375 days,* it was at some level of drawdown off its most recent ATH. (*I include weekends and holidays for ease of calculation).
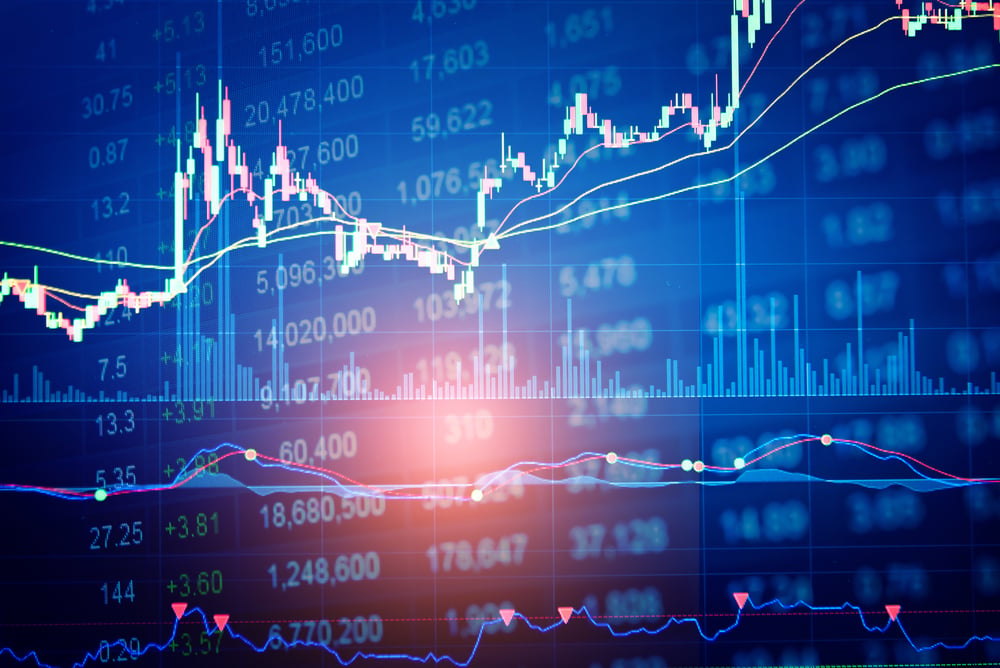
Drawdowns are a common occurrence, as evidenced in the chart below; any time that the blue line is below the top horizontal line of the chart, the S&P 500 Index is in a drawdown off its most recent ATH. Sometimes those drawdowns are shallow, sometimes they are deep, but eventually, the index has recovered to a new ATH on the strength of the US economy and US business profitability.

It is also important to note that the S&P 500 is still positive over the past year!
|
Start Date |
2/19/2025 |
1/1/2025 |
3/11/2024 |
|
|
End Date |
3/10/2025 |
3/10/2025 |
3/10/2025 |
|
|
Market Index |
Asset Class |
Since Recent S&P 500 ATH |
YTD |
1 Year |
|
S&P 500 TR USD |
US Large Cap Stocks |
-8.32 |
-4.30 |
11.06 |
|
S&P Completion TR USD |
US Small/Mid Cap Stocks |
-13.95 |
-9.17 |
1.60 |
|
MSCI EAFE NR USD |
International Developed Stocks |
0.50 |
9.37 |
7.35 |
|
MSCI EM NR USD |
Emerging Market Stocks |
-2.15 |
3.81 |
9.94 |
|
Bloomberg US Agg Bond TR USD |
US Investment Grade Fixed Income |
1.86 |
2.62 |
4.43 |
|
Bloomberg High Yield Corporate TR USD |
US Non-Investment Grade Fixed Income |
-0.11 |
1.55 |
8.77 |
Our point: this level of drawdown is normal relative to other historical drawdowns for the S&P 500.
How should I react to the recent market volatility and downturn?
First and foremost: don’t panic sell. We continue to believe that most US-based investors’ allocation to US large-cap stocks will provide the core of their growth of capital over the long term. There is very much to like currently about American companies and the American economy.
That being said, we also acknowledge that:
- Valuations for many US large-cap stocks have been high relative to their history, and multiple contraction (i.e., a drop in the valuation multiple paid for stocks) has been a real (and now realized) risk.
- Combined with rising uncertainty about the direction, trajectory, and shape of the US economy, it may be time for some clients to reevaluate the level of their US large-cap equity exposure.
Over the past year, we have encouraged clients to diversify portfolios that were especially heavy in US large-caps (especially large-cap growth) stocks into other asset classes, including international equities and investment-grade fixed income. We continue to encourage clients to be properly diversified and allocated in accordance with their risk tolerance and investment objectives.
If you have not already, work with your financial advisor to ensure that your portfolio is prudently diversified and invested.
What should I expect going forward?
We expect more volatility until uncertainty about the future direction and trajectory of the US economy declines.
Right now, the US economy continues to look strong, and if that remains the case, then the recent drawdown could be clearing out some of the frothiness in valuations.
However, if economic conditions or policy decisions begin to negatively impact US economic growth and US corporate profitability in a material way, then we would expect US stock prices to continue to decline.
SOURCE: Morningstar Direct, accessed 3/11/2025
-
Like it? Share it:
-

-

-

You may also like
Jan 21, 2026
Written By: Nate Garrison, CIO, World Investment Advisors; Anthony Silva, Senior Director of Strateg...
Oct 1, 2019
Conventional wisdom says that what goes up must come down. But even if you view market volatility as...